

Stocks and Shares ISA Returns: What’s a Realistic Average?
Over the long run, UK shares have returned about 5% a year above inflation, or about 9% a year before it, on Barclays data covering 1899 to 2024. Cash returned about 0.5% a year above inflation over the same period. That is the closest thing to an honest “average” for a stocks and shares ISA. It comes with two warnings: almost no single year looks like it, and the return an investor actually keeps is often lower than the market’s. Past performance is not a guide to the future.
People search for one number because one number would make planning simple. Here is what the record actually shows, and how to read it without being misled by it.
What have shares returned over the long run?
| Per year before inflation | Per year after inflation | Period | |
|---|---|---|---|
| UK shares | 8.9% | 5.0% | 1899 to 2024 |
| UK government bonds (gilts) | 4.8% | 1.3% | 1899 to 2024 |
| Cash | 4.5% | 0.5% | 1899 to 2024 |
| US shares | 9.8% | 6.6% | 1900 to 2025 |
UK figures: Barclays, Bloomberg and Courtiers data, published in the Courtiers Equity and Gilt Study (April 2025). US figures: UBS Global Investment Returns Yearbook 2026 (Dimson, Marsh and Staunton). Past performance is not a guide to the future.
A stocks and shares ISA can hold shares from anywhere, so the UK isn’t the whole picture. The UBS Yearbook, which tracks markets back to 1900, found shares were the best-performing type of investment in all 21 countries with an unbroken record. The US, now the largest market in most global funds, has the highest figure in the table. None of that is a promise about the next 30 years.
Why the figure after inflation is the one that matters
Prices in the UK rose by roughly 3.7% a year over the same 125 years, so a headline return of 9% was worth about 5% in what the money could actually buy. Cash at 4.5% looks respectable until inflation takes almost all of it back. Over 20 years, £20,000 growing at 5% a year above inflation becomes about £53,000 in today’s money. At 0.5% it becomes about £22,100. Illustrative, not a forecast, and past performance is not a guide to the future.
Why one average figure misleads
An average is what’s left after the good years and the bad years have been added together. Very few individual years land anywhere near it. Between May 1972 and December 1974, UK shares fell 73% (FT 30 index, Sarasin Compendium of Investment). In 1975 they gained almost 100% after inflation, the best year on record (Barclays Equity Gilt Study). In 2025 they gained about 23% (Courtiers Equity Gilt Study 2026). All of those sit inside the same long-run 5%.
How often have shares beaten cash?
The Barclays Equity Gilt Study 2024 found UK shares beat cash in 70% of two-year periods and 91% of ten-year periods. So the odds have improved with time, but even over a decade there were stretches where cash came out ahead. Past performance is not a guide to the future, and the value of investments can fall as well as rise.
That’s the honest version of “average”: a long-run tendency, reached through years that rarely resemble it. It’s also why I compare the two side by side in cash ISA vs stocks and shares ISA.
Why your return isn’t the market’s return
Two things sit between what a market returns and what an investor keeps.
The first is cost. A fee is taken every year, in the bad years too, and the money it removes stops compounding. On an illustrative £300 a month at 8% a year for 30 years, all-in costs of 0.75% a year take about 14% of the final pot, and 1.5% takes about a quarter. That’s the whole argument in why fees decide your returns.
The second is behaviour. Morningstar’s Mind the Gap 2025 study found the average dollar invested in US funds earned 7.0% a year over the ten years to the end of 2024, while the funds themselves returned 8.2%. The 1.2 percentage point difference, about 15% of the total, came from buying and selling at the wrong moments. That’s the behaviour gap, and it’s the one part of your return you fully control.
What the ISA adds
Inside an ISA there’s no tax on gains and no tax on dividends, so the whole return stays invested. Outside one, in the 2026 to 2027 tax year, dividends above £500 a year are taxed at 10.75%, 35.75% or 39.35%, and gains above £3,000 at 18% or 24%. These figures are correct at the time of writing and can change, so check gov.uk for the current numbers. I go through it line by line in do you pay tax on an ISA?
What a few percentage points add up to
Small differences in the yearly figure become large differences in the final pot, because of compound returns. Take £300 a month, £108,000 paid in over 30 years: at 3% a year it comes to about £174,800, at 5% about £249,700, and at 7% about £366,000. Illustrative, not a forecast. Returns aren’t steady like this, and the value of investments can fall as well as rise.
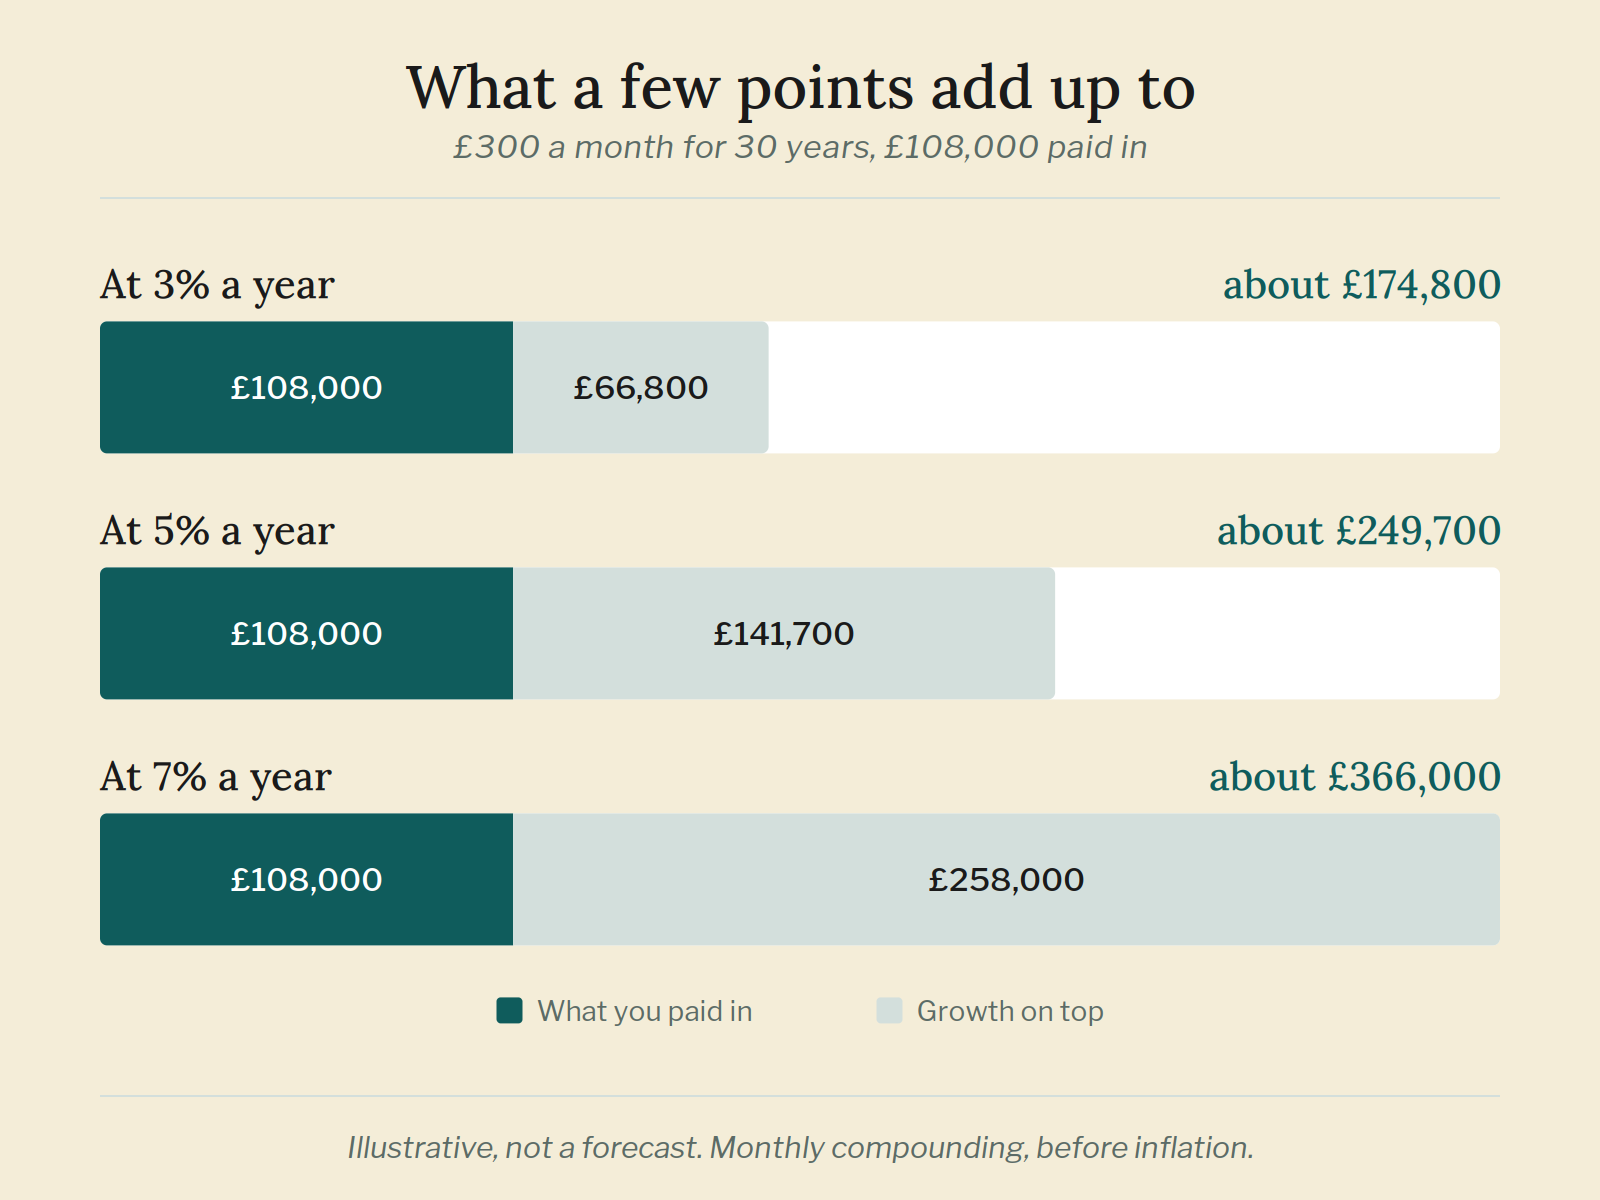
Over 20 years the same £300 a month (£72,000 paid in) comes to about £98,500, £123,300 and £156,300 at 3%, 5% and 7%. The longer the money stays in, the more the gap between them widens, which is why time matters as much as the rate. It’s the same arithmetic behind what it actually takes to reach £1 million. You can run your own numbers through the ISA growth calculator.
If you’re starting out, my free ISA Starter guide walks through opening and using a stocks and shares ISA in about ten minutes, and the book sets out the whole long-term method.
What is a good return on a stocks and shares ISA?
There’s no fixed benchmark, because it depends on what the ISA holds and over what period. As a yardstick, UK shares have returned about 5% a year above inflation since 1899, and cash about 0.5%. A return close to inflation plus a few percent over a decade or more would sit within that long-run record. Past performance is not a guide to the future.
Is a stocks and shares ISA worth it?
It depends on when the money is needed. For money that can stay invested for ten years or more, shares have beaten cash in most periods on record, and the ISA removes tax on what they earn. For money needed within a year or two, the steadier value of cash has usually mattered more. It’s a question of timeframe and temperament, not a recommendation.
Can you lose money in a stocks and shares ISA?
Yes. Investments can fall as well as rise, sometimes sharply, as between 1972 and 1974, and you can get back less than you put in. The ISA protects the money from tax, not from markets falling.
How long should you invest for?
On the historical record, longer periods have given shares better odds: they beat cash in 70% of two-year periods and 91% of ten-year periods. MoneyHelper, the government-backed guidance service, frames investing as something for goals more than five years away, and ten years or more has given the odds the most room to work. Past performance is not a guide to the future.
Key takeaways
All figures are correct at the time of writing and can change, so always check gov.uk for the current numbers. The value of investments can go up and down, and you can get back less than you put in. This is general information, not financial advice. If you are unsure, speak to a regulated financial adviser.